

Building IoT Dashboards with Node-RED: A Complete Guide for Beginners and Experts

The Internet of Things (IoT) is transforming how we interact with devices, collect data, and make decisions. Central to this transformation is the ability to visualize and control IoT data effectively. Node-RED, a powerful flow-based development tool, has emerged as a popular platform for building intuitive IoT dashboards. This guide will walk you through the process of creating dynamic, real-time IoT dashboards using Node-RED, helping you monitor and manage your connected devices with ease.
What is Node-RED?
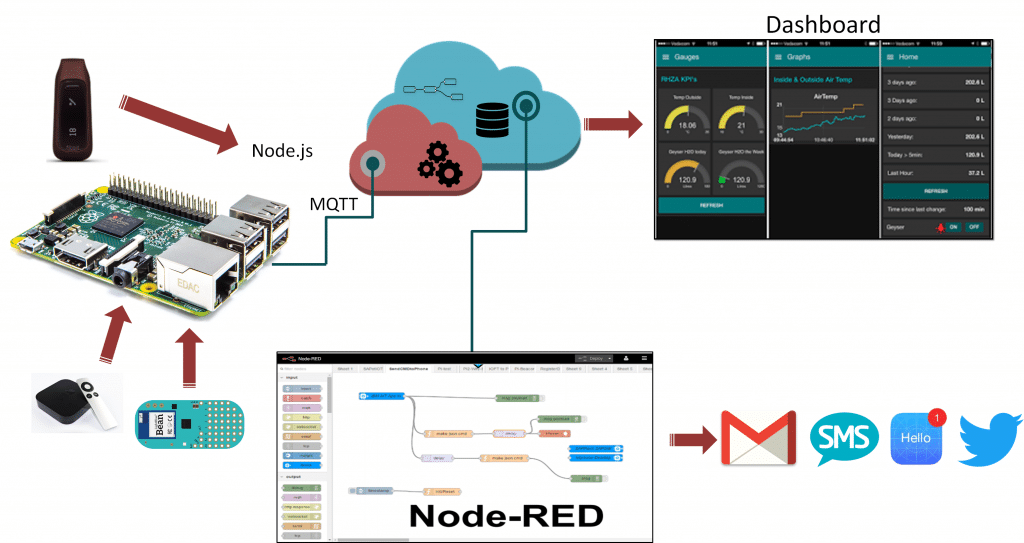
Node-RED is an open-source, low-code programming tool developed by IBM for wiring together hardware devices, APIs, and online services. It uses a visual flow-based interface where you drag and drop nodes to create workflows, making it accessible to both beginners and experienced developers.
Key features include:
-
Browser-based flow editor
-
Wide range of pre-built nodes for IoT protocols (MQTT, HTTP, WebSocket)
-
Easy integration with sensors, devices, and cloud services
-
Built-in dashboard nodes for creating user interfaces
-
Extensible with custom nodes and JavaScript functions
Why Use Node-RED for IoT Dashboards?
Node-RED simplifies the process of building IoT dashboards by:
-
Reducing development time with drag-and-drop programming
-
Supporting real-time data visualization with charts, gauges, and tables
-
Enabling easy integration with various IoT devices and protocols
-
Allowing customization through JavaScript and CSS
-
Running on lightweight hardware like Raspberry Pi or cloud platforms
Setting Up Node-RED for IoT Dashboards
Step 1: Install Node-RED
Node-RED can be installed on multiple platforms, including Windows, macOS, Linux, and Raspberry Pi.
For Raspberry Pi, use the official script:
bash <(curl -sL https://raw.githubusercontent.com/node-red/linux-installers/master/deb/update-nodejs-and-nodered)
For other platforms, install Node.js first, then install Node-RED via npm:
npm install -g --unsafe-perm node-red
Step 2: Start Node-RED
Run the following command in your terminal:
node-red
Access the editor by navigating to http://localhost:1880 in your web browser.
Installing the Node-RED Dashboard
To create dashboards, install the Node-RED Dashboard nodes:
-
Open the Node-RED editor.
-
Click the menu (top right) → Manage palette → Install.
-
Search for node-red-dashboard.
-
Click install.
This adds UI nodes like charts, gauges, buttons, sliders, and text elements.
Building Your First IoT Dashboard
Step 1: Create a Simple Flow
Drag an inject node (to simulate data) and a debug node (to view output) onto the workspace.
Connect the inject node to the debug node.
Click the inject node’s button to send a message and see the output in the debug sidebar.
Step 2: Add a Dashboard Chart
Drag a chart node from the dashboard section.
Connect the inject node to the chart node.
Double-click the chart node to configure:
-
Group: Create a new group under a new tab (e.g., “Temperature”).
-
Name: “Temperature Chart”
-
Chart type: Line chart
Deploy your flow and click the dashboard link (top right menu → Dashboard) to view the chart.
Step 3: Simulate Sensor Data
Modify the inject node to send random temperature values:
-
Change payload type to JSON.
-
Use the following JSON:
{"temperature": Math.floor(Math.random() * 30) + 10}
Use a function node to extract the temperature value and format it for the chart:
msg.payload = msg.payload.temperature;
return msg;
Connect the inject node → function node → chart node.
Set the inject node to repeat every 5 seconds.
Deploy and watch the chart update in real-time.
Integrating Real IoT Devices
Using MQTT Protocol
MQTT is a lightweight messaging protocol widely used in IoT.
-
Add an MQTT in node.
-
Configure it to connect to your MQTT broker (e.g., Mosquitto).
-
Subscribe to the topic your device publishes (e.g., home/temperature).
-
Connect the MQTT node to a function node to parse data.
-
Connect the function node to dashboard nodes (charts, gauges).
Example Function Node for MQTT Data
// Assuming payload is JSON string
let data = JSON.parse(msg.payload);
msg.payload = data.temperature;
return msg;
Deploy and monitor live sensor data on your dashboard.
Customizing Your Dashboard
Layout and Themes
-
Use the dashboard sidebar to create multiple tabs and groups.
-
Organize widgets logically (e.g., temperature, humidity, controls).
-
Customize themes via the dashboard settings for colors and fonts.
Adding Controls
Add button, slider, or switch nodes to send commands back to devices via MQTT or HTTP.
Example: A button to turn a light on/off.
-
Button node → MQTT out node publishing to home/light/control.
Advanced Features
Real-Time Alerts
Use switch and notification nodes to trigger alerts when sensor values exceed thresholds.
Example: Notify if temperature > 30°C.
Data Logging
Integrate with databases like InfluxDB or Google Sheets to store historical data.
Use influxdb out or google sheets nodes for logging.
User Authentication
Secure your dashboard by enabling user authentication in Node-RED settings.
Deploying Node-RED Dashboards
On Raspberry Pi
Run Node-RED as a service for automatic startup.
sudo systemctl enable nodered.service
sudo systemctl start nodered.service
On Cloud Platforms
Deploy Node-RED on cloud services like IBM Cloud, AWS, or Heroku for remote access.
Best Practices for Building IoT Dashboards
-
Keep UI simple and intuitive.
-
Use real-time data sparingly to reduce bandwidth.
-
Group related controls and data.
-
Test on multiple devices (desktop, tablet, mobile).
-
Regularly backup your flows.
Conclusion
Node-RED offers a powerful yet accessible platform for building IoT dashboards that visualize and control your connected devices. Its visual programming interface, extensive node library, and built-in dashboard capabilities make it ideal for hobbyists and professionals alike. By following this guide, you can create real-time, interactive dashboards tailored to your IoT projects, enhancing monitoring, control, and data-driven decision-making.
Frequently Asked Questions
1. Can Node-RED dashboards be accessed remotely?
Yes, by deploying Node-RED on a server or cloud platform and configuring secure access.
2. Is programming knowledge required to use Node-RED?
Basic understanding of logic helps, but Node-RED’s drag-and-drop interface minimizes coding.
3. Can I integrate multiple IoT protocols in one dashboard?
Absolutely, Node-RED supports MQTT, HTTP, WebSocket, Modbus, and more.
4. How do I secure my Node-RED dashboard?
Enable user authentication, use HTTPS, and restrict network access.
5. Can Node-RED dashboards be customized for mobile devices?
Yes, the dashboard is responsive and works well on smartphones and tablets.